KLR.gg (in-house product) · Gaming · Esports analytics
KLR.gg: automated CS2 match analytics for private lobbies
A platform that pulls server logs, match stats and demo recordings from Counter-Strike 2 community servers automatically, scores every duel and round, and turns them into player ratings, trends and balanced teams — no uploads, no spreadsheets.
- Duration
- 4 months to launch, ongoing
- Published
- 26 August 2026
- Stack
- PythonpandasFastAPIPostgreSQLNext.jsTypeScriptNode.jsMinIO (S3)DockerSteam OpenIDStripe
100%
of match days ingested with no manual upload
4
rating models: 2.0, 3.0, Round Swing, Glicko-2
~2 s
pipeline time per map from server log
4
balanced team splits per lobby
What was the starting point?
The starting point was an argument every group of friends who play Counter-Strike 2 on their own server has every week: who is actually good, and how to split the teams fairly. Public stats sites cover official matchmaking, not private lobbies, so someone keeps a spreadsheet until they stop. The audience is not small: Counter-Strike 2 is consistently among the most played titles on Steam, with concurrent player counts in the hundreds of thousands to over a million (Steam, 2024), and Statista (2024) puts the esports market in the low billions of dollars a year.
KLR is our own product built to settle those arguments with numbers. It started as one Python script for a closed lobby of about 25 players and grew into a multi-tenant web platform. It is also our reference project for event-data engineering: automatic collection, an idempotent parsing pipeline, and ratings people trust enough to argue about.
What problem had to be solved?
The problem was turning raw server output into ratings people trust, without anyone uploading anything. The data is there: a CS2 server with the MatchZy plugin (2024 docs) writes a log line for every kill, a CSV of per-player stats for every map, and a GOTV demo of every match. But raw numbers are not a rating — kills without round impact, missing round counts, players who change nicknames, several Steam accounts per person. A leaderboard that players do not trust is worse than no leaderboard.
The leaderboard
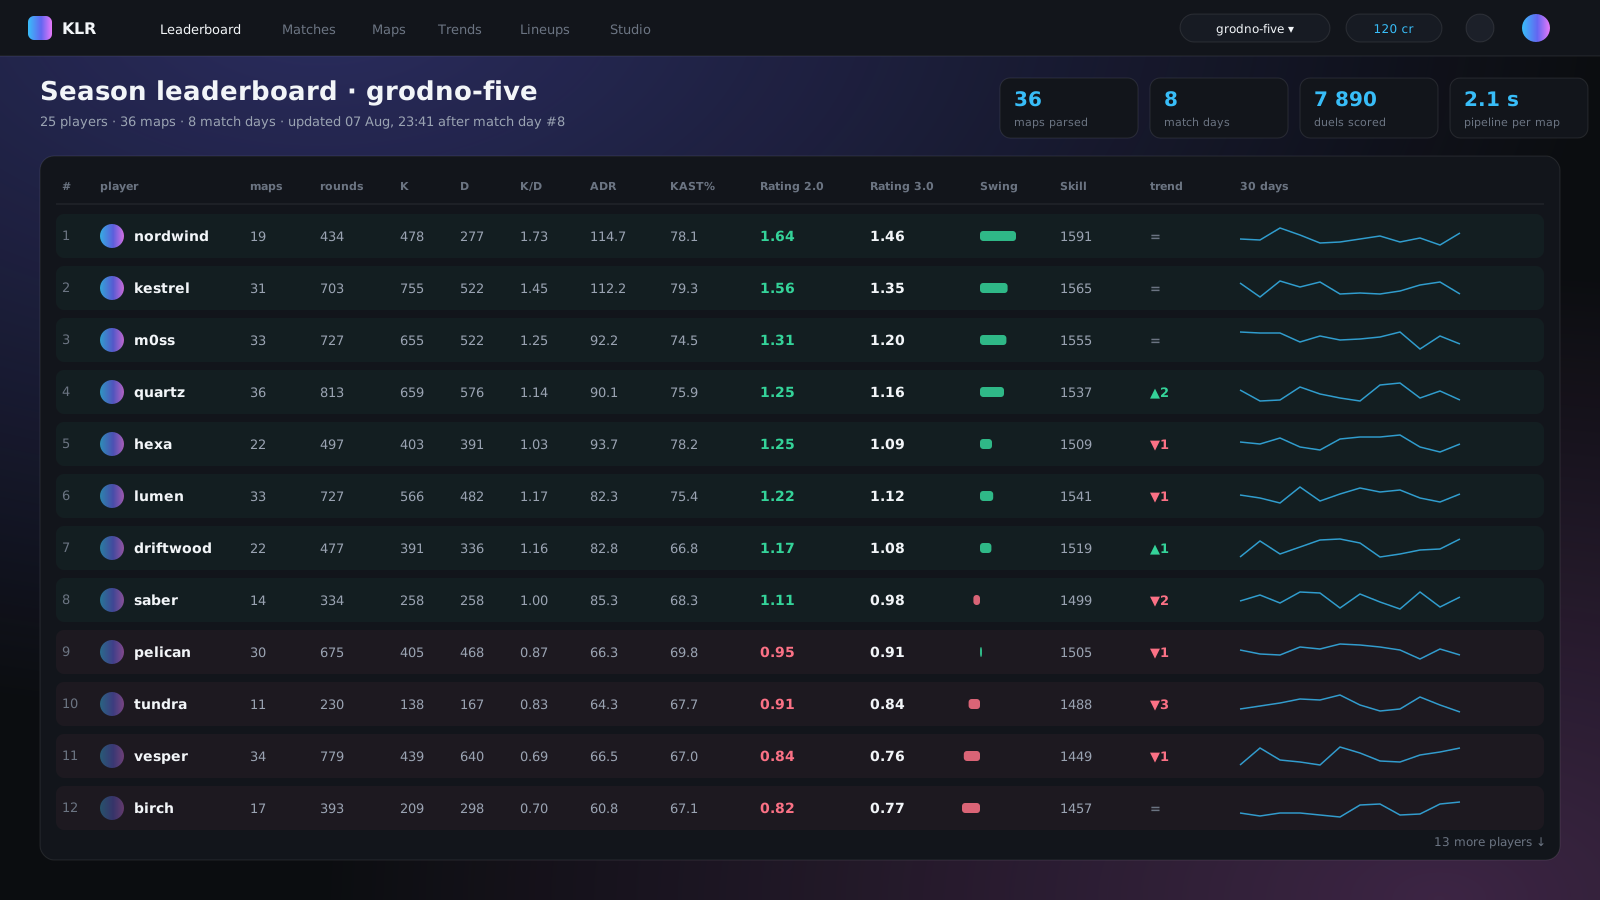
One lobby, one season: HLTV-style Rating 2.0 and 3.0, Round Swing — how much each player's actions moved the round win probability — and a Glicko-2 skill rating that treats every kill as a duel between two players.
How was it built?
It was built as a collection worker, a recompute-from-scratch rating pipeline and a multi-tenant web product. The worker pulls logs, stats and demos from each community server; the pipeline parses logs into duels and computes four ratings — HLTV-style Rating 2.0 and 3.0 (HLTV published the 2.0 formula’s components in 2017), Round Swing, and a Glicko-2 skill rating (Glickman’s system with rating deviation and volatility, 2012). Every run recomputes the whole season, so there is no double counting and re-running is safe.
- Automatic collection. A Python worker connects over FTP/FTPS, detects new files by modification time, pulls them into S3-compatible storage and queues a recompute. Credentials are stored encrypted. Logs (~0.5 MB per map) are the primary source and are kept; demos are the fallback and are deleted after parsing.
- Rating pipeline. pandas modules parse logs into duels, compute round-by-round KAST, Round Swing with an economy weighting for each kill, Rating 2.0 and 3.0, per-map ratings and Glicko-2. About two seconds per map.
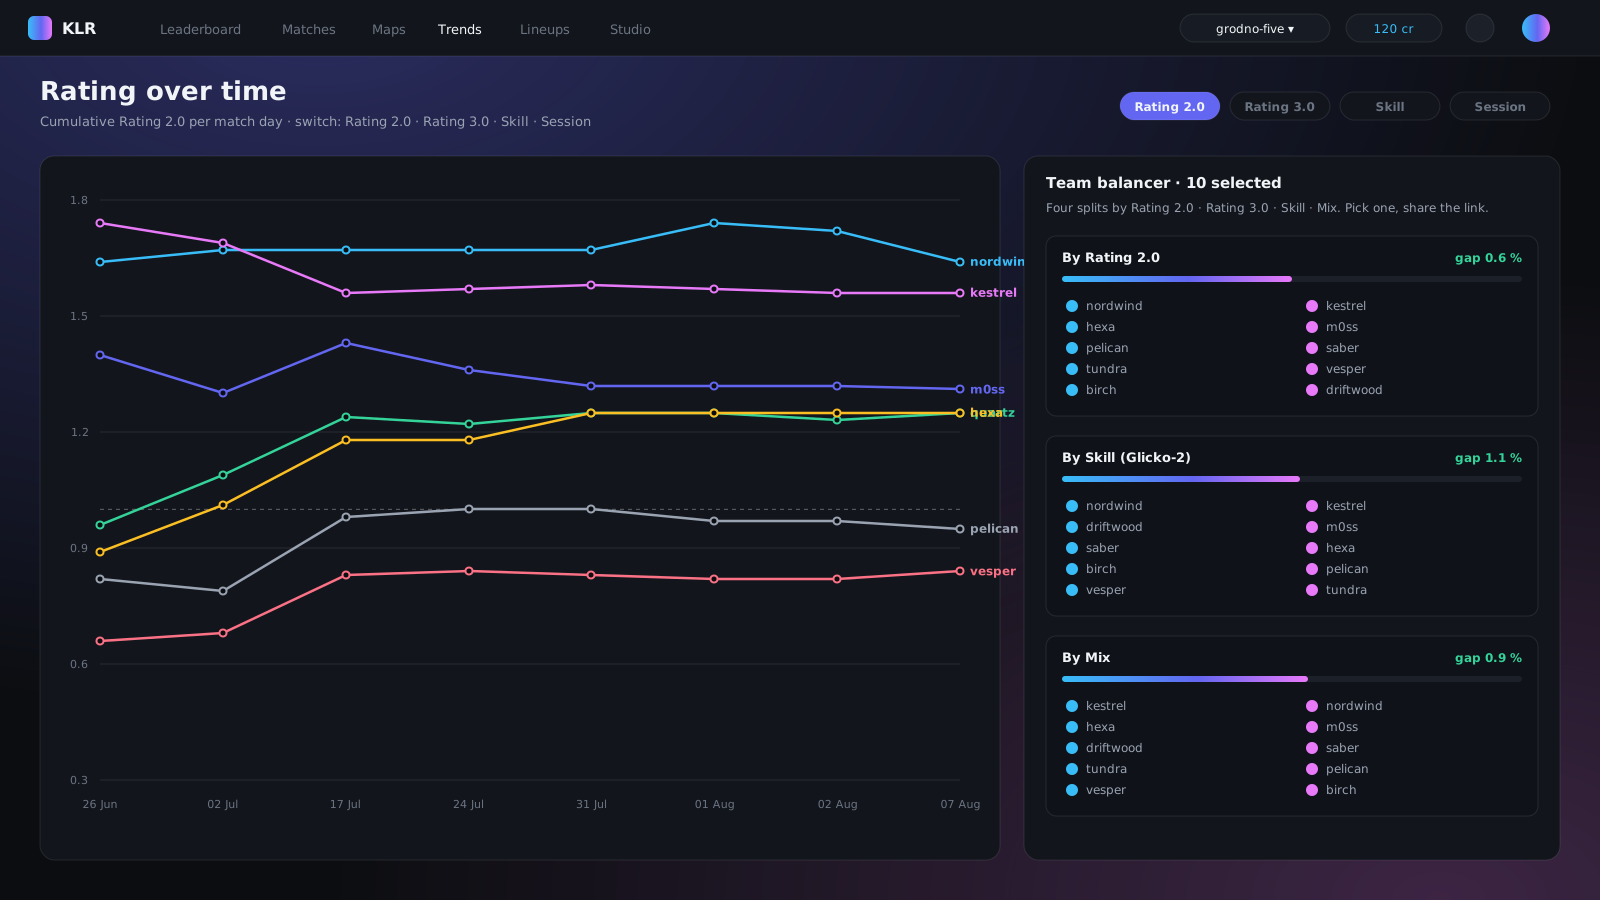
- Team balancer. For a chosen set of players it proposes four splits — by Rating 2.0, Rating 3.0, Skill and a mix — with the expected gap between teams. The logic is mirrored in TypeScript so the web does it instantly; shared lineups get a public link with an Open Graph preview.
- Product. Multi-tenant lobbies with roles, Steam OpenID sign-in, statistics snapshots with one-click rollback, notifications, credits paid via Stripe for the render studio (2D round replays), GDPR clickwrap consent with audit, data export and account deletion.
- Steam GC bot. A Node.js bot fetches official matchmaking demos by share code, so ranked games count in the same rating as private ones.
Spreadsheet vs automated pipeline: what changes for a private lobby?
The table compares the spreadsheet most lobbies start with and the automated pipeline KLR replaced it with. A spreadsheet is free and needs no server access, but it depends on one person, cannot compute round-level metrics from a stats CSV, and silently double-counts when a map is entered twice. The pipeline needs FTP credentials and a worker, and then nobody touches it.
| Criterion | Spreadsheet | KLR pipeline |
|---|---|---|
| Data entry | By hand after each match day | Automatic from server logs |
| Round-level metrics (KAST, Round Swing) | Not available | Computed from every kill line |
| Re-entry of the same map | Double counted | Idempotent full-season recompute |
| Nickname and multi-account changes | Manual fixes | Steam ID mapping |
| Team balancing | Captains pick | Four rating-based splits, 0.6% expected gap |
| Time per map | Minutes | About 2 seconds |
How the data flows
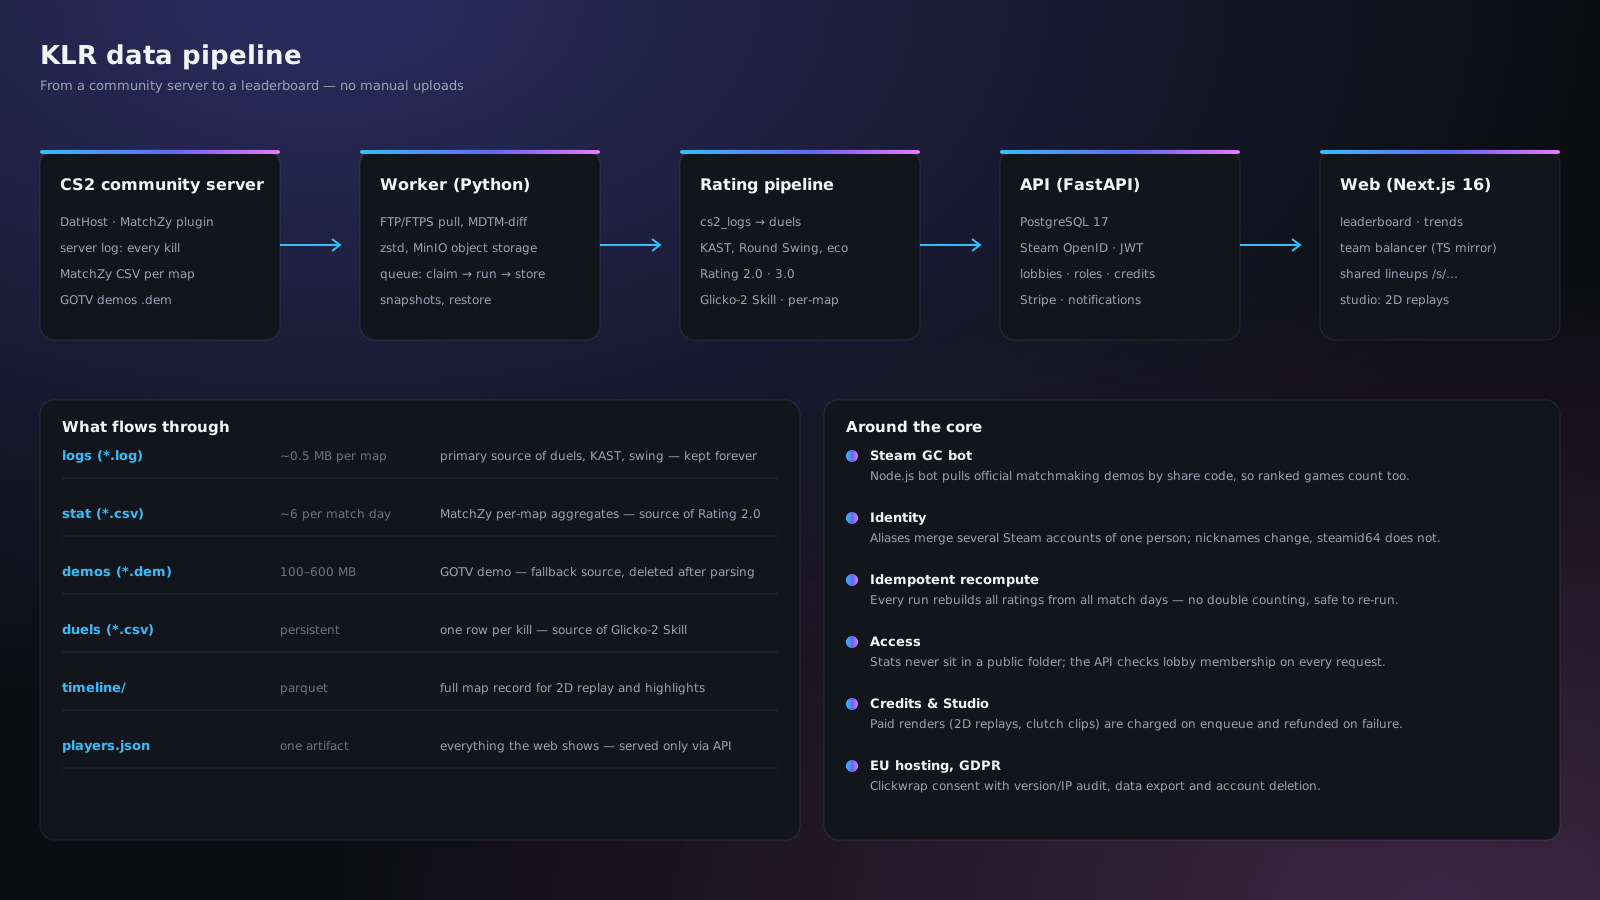
From a game server to a leaderboard without a human in the loop: worker, pipeline, API and web are separate services in Docker; the only artifact the web ever sees is one JSON per lobby, served through the API with access checks.
Results
Ingestion is fully automatic and the pipeline keeps up with match nights: a six-map evening is parsed and rated within a minute of the last round. The balancer closes the gap between teams to under one percent of predicted round-win share.
Data table
| Maps | |
|---|---|
| Day 1 | 4 |
| Day 2 | 5 |
| Day 3 | 4 |
| Day 4 | 6 |
| Day 5 | 4 |
| Day 6 | 3 |
| Day 7 | 5 |
| Day 8 | 5 |
Average over the season; gap is the difference in predicted round-win share between the two teams.
Data table
| Gap | |
|---|---|
| Captains picking | 8.4% |
| Random | 11.2% |
| KLR balancer, best split | 0.6% |
Trends and lineups
Rating over time per match day, switchable between four metrics, next to the team balancer: the two screens that actually get opened before a match night.
Stack
Python 3 rating pipeline (pandas, matplotlib, awpy for demo parsing); worker on ftplib with zstd and MinIO; FastAPI with SQLAlchemy and Alembic on PostgreSQL 17; Next.js 16 with React 19 and Tailwind 4; Node.js Steam GC bot; Steam OpenID, JWT sessions, Stripe. Everything runs in Docker Compose locally and under systemd behind nginx on a VPS in the EU.
Who is this approach for?
This approach is for any team that needs an event-data platform: automatic collection from many remote sources, a parsing pipeline that must be idempotent and fast, scoring models people can trust, and a multi-tenant web product with roles, billing and compliance on top. Strip away the game and the same architecture serves telematics, IoT fleets, trading logs and clickstream analytics. Compliance is part of the design rather than a bolt-on: because player profiles are personal data, account deletion and export were built in from the first release, as the GDPR right to erasure (Article 17, 2016) requires.
Frequently asked questions
More case studies
Erudil: an AI engine that prices every match outcome
Our own product. A probability engine turns match data into outcome probability matrices, compares them with bookmaker odds, and publishes a tamper-proof track record of every pick — wins and losses alike.
- Sports analytics
- Python
- PyTorch
- PostgreSQL
AI knowledge assistants for a 30 000-employee grocery chain
Three RAG assistants on one platform — for commercial staff, store directors (by voice, from the shop floor) and HR — answer questions from corporate regulations with a citation to the exact clause, or say honestly that they do not know — so staff stop phoning head office for routine questions.
- Retail
- Python
- LangChain
- PostgreSQL + pgvector
Document AI that reads 1 300 supplier invoices a day
Scans and photos of invoices, delivery notes and acts go through a multimodal model that extracts typed fields with a confidence score per field, reconciles them with the supplier and contract master data, and posts to the ERP. Only low-confidence documents reach a human — roughly one in nine.
- Retail · Finance
- Python
- PyTorch
- Multimodal LLM