Erudil (in-house product) · Sports analytics
Erudil: an AI engine that prices every match outcome
Our own product. A probability engine turns match data into outcome probability matrices, compares them with bookmaker odds, and publishes a tamper-proof track record of every pick — wins and losses alike.
- Duration
- 14 months to launch, ongoing
- Updated
- 28 August 2026
- Stack
- PythonPyTorchPostgreSQLLaravelReactRedisDockerAWS
25k+
matches analysed
61.8%
hit rate, high-confidence tier
10 000
simulations per match
+2.1%
closing-line value
What was the starting point?
The starting point was a market full of tipsters who show wins and hide losses. We wanted the opposite: a product where every number is a probability, every probability is checked against the market, and every published pick stays on the page whether it won or lost. The market itself is large and regulated — Statista (2024) puts global sports-betting revenue in the tens of billions of dollars a year, and the UK Gambling Commission’s industry statistics (2024) show online betting as the largest regulated segment there — which is exactly why a verifiable track record matters.
Erudil is that product — built and operated by Glanit as our own line of business. It is also the reference project for our forecasting and probability-modelling work: the same engineering shows up in demand forecasting, dynamic pricing and risk scoring for clients.
What problem had to be solved?
The problem was to price dozens of outcomes of one match — winner, draw, totals, handicaps, both teams to score — from one coherent probability model, not a list of separate guesses; otherwise the model can claim a 60% home win and a 50% under-1.5-goals at the same time. The classical answer goes back to Dixon and Coles (1997), who modelled football scores with adjusted Poisson distributions and showed where the betting market was inefficient; the engineering problem is keeping such a model consistent, live and honest.
The model must also update when a line-up changes an hour before kick-off, cope with six data providers that disagree with each other, and — hardest of all — know when it has no edge and say so instead of forcing a pick.
The match view
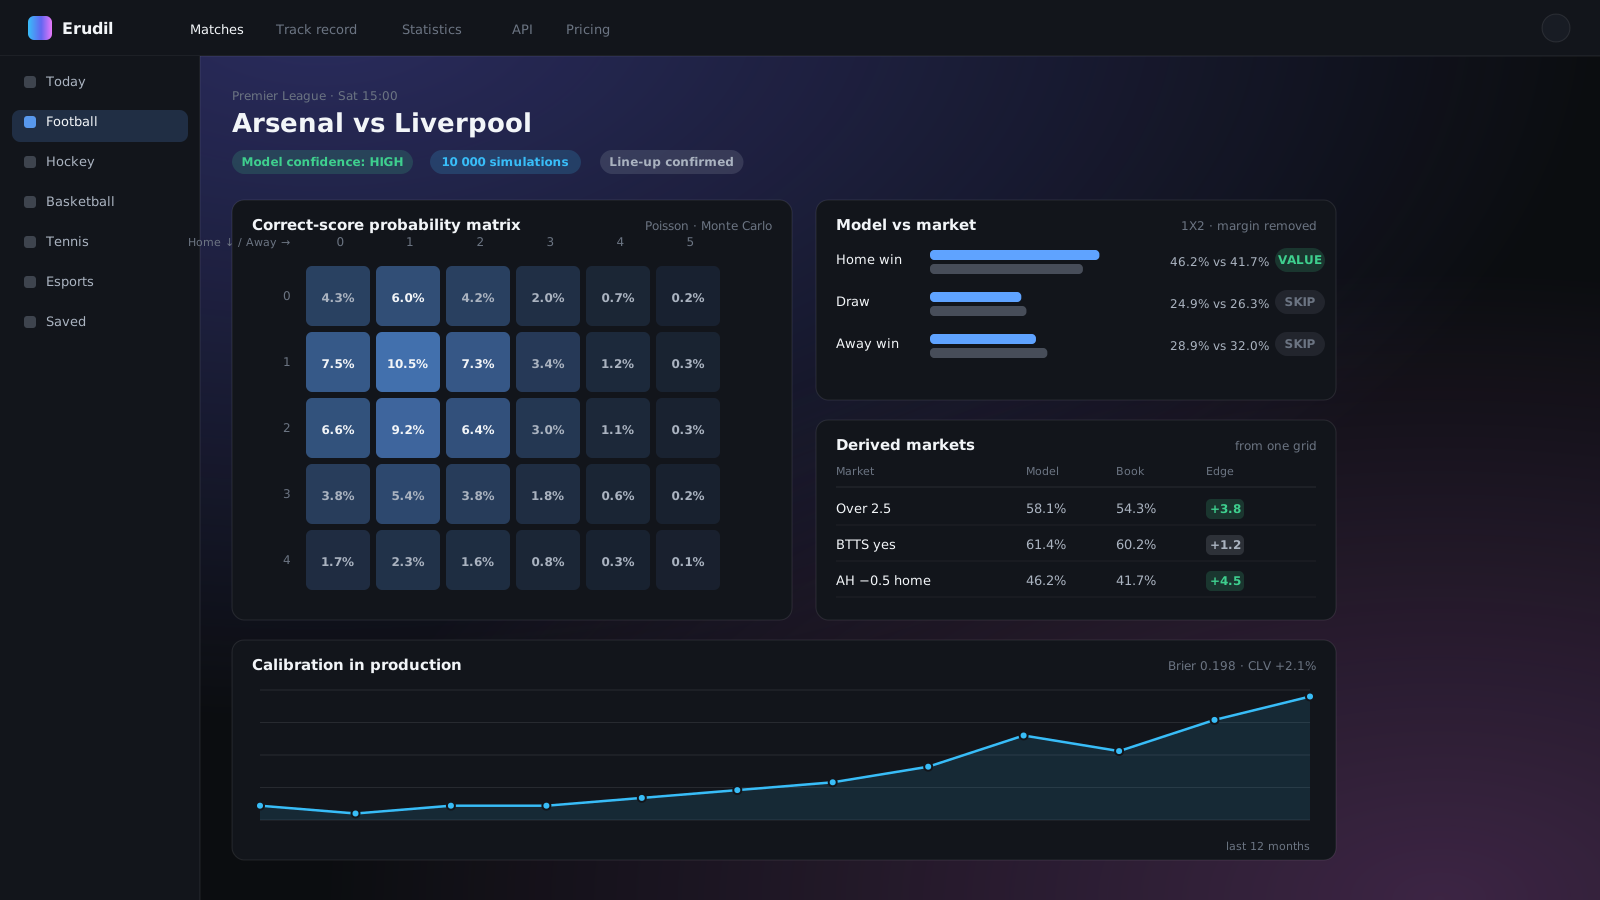
Everything a user sees is derived from one correct-score grid: the 1X2 probabilities, totals, handicaps and BTTS never contradict each other because they are read off the same matrix.
How was it built?
It was built around one correct-score probability matrix per match, produced by a Poisson-based Monte Carlo simulation of ten thousand virtual matches and cross-checked by an ensemble of specialised modules. Every market is read off that matrix, so prices never contradict each other. Bookmaker odds are converted to implied probabilities with the margin removed and compared with the model; the pick is published only where the edge exceeds a calibrated threshold, and its success is judged against the closing line — the measure of skill that Pinnacle’s own betting resources (2024) describe as the most reliable long-run indicator.
- Outcome probability matrix. Goal expectancy per side from expected goals, expected points, form, head-to-head, venue and weather, simulated into a correct-score grid.
- Multi-module ensemble. Attack vs defence, historical trends, an NLP module that reads injury and line-up news, and a market module that tracks price and money flow.
- Market comparison. Where the model’s probability exceeds the market’s by more than the threshold, the pick is flagged as positive expected value; otherwise the engine returns a SKIP verdict.
- Public, tamper-evident record. Every prediction is hashed (SHA-256, the NIST FIPS 180-4 standard) before publication; hit rate and ROI are published by confidence tier, sport and competition, and nothing is ever deleted.
- Product surface. Web app with subscriptions and a token model, free daily picks, statistics pages, a B2B API and a white-label option, in four languages.
Tipster picks vs a calibrated probability engine: what is the difference?
The table contrasts the usual tipster service with the engine behind Erudil. A tipster publishes a pick and a story; the engine publishes a probability, the market price it was compared with, and a verdict that can be SKIP. The difference is not accuracy on a good week — it is whether the record can be audited on a bad one.
| Criterion | Typical tipster | Erudil engine |
|---|---|---|
| Output | Pick + narrative | Probability matrix + market edge |
| Consistency across markets | None enforced | All markets from one grid |
| When there is no edge | Pick anyway | SKIP verdict |
| Track record | Curated | Hashed before publication, never deleted |
| Quality metric | Win streaks | Brier score, closing-line value |
| Updates on news | Manual, if at all | Recomputed on line-up and market events |
From data to verdict
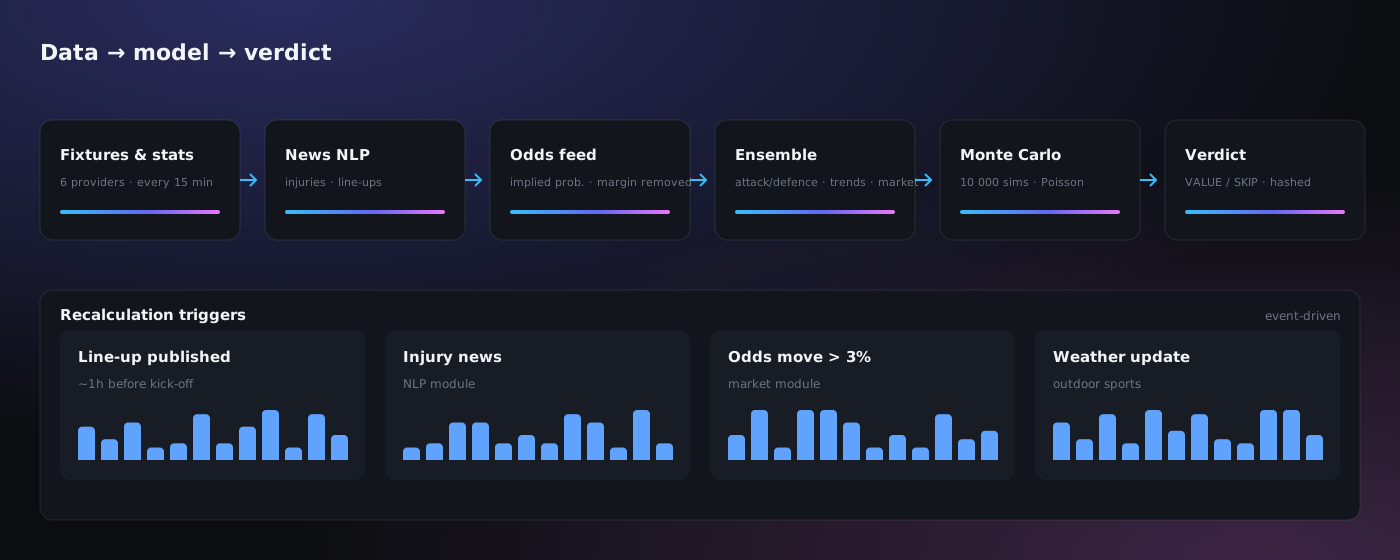
Six data providers, a news-reading NLP module and an odds feed converge on the ensemble; every event that can move a probability — a confirmed line-up, an injury, a 3% odds move — triggers a recalculation.
Results in numbers
The model's calibration is tracked publicly. Hit rate is reported per confidence tier so that a high-confidence pick means something; the Brier score and closing-line value are the two numbers we watch in production — a model that beats the closing line is a model with a real edge.
- High
- Medium
- Low
Graded picks only; SKIP verdicts are excluded by definition.
Data table
| High | Medium | Low | |
|---|---|---|---|
| Sep | 60.1% | 54.2% | 48.3% |
| Oct | 61% | 55% | 50.1% |
| Nov | 61.9% | 53.4% | 49% |
| Dec | 61.2% | 55.1% | 51.2% |
| Jan | 62.6% | 56% | 50.4% |
| Feb | 62% | 55.3% | 49.2% |
| Mar | 61.4% | 54.6% | 50% |
| Apr | 62.1% | 55.2% | 51.1% |
| May | 62.3% | 56.1% | 50.3% |
| Jun | 63% | 55.4% | 50% |
| Jul | 62.2% | 55% | 51.2% |
| Aug | 61.8% | 55.7% | 50.4% |
Data table
| Matches | |
|---|---|
| Football | 13,840 |
| Basketball | 4,210 |
| Hockey | 3,120 |
| Tennis | 2,260 |
| Esports | 1,410 |
| American football | 640 |
The public track record
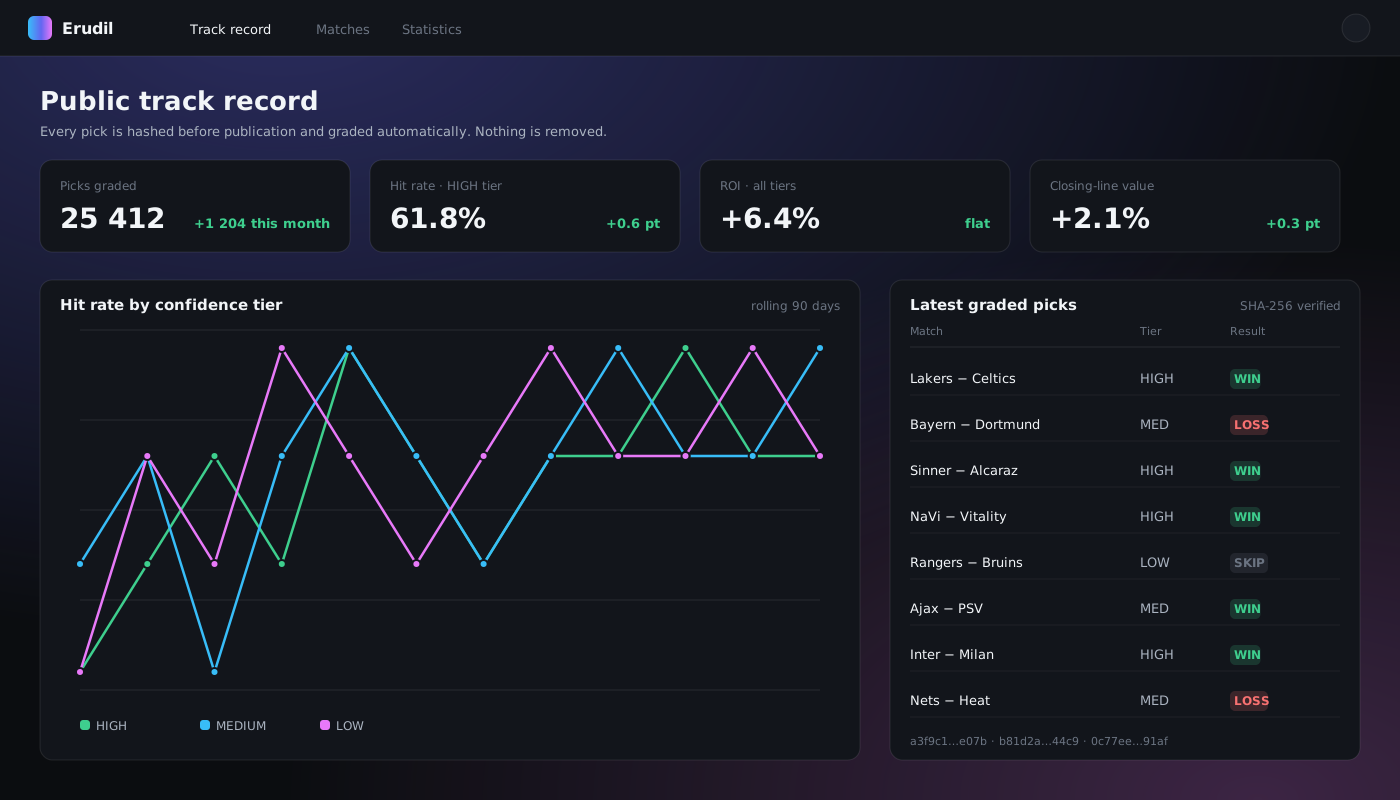
The page that makes the product honest: every pick is hashed before it is shown, graded automatically after the match, and counted in the tier statistics. A user can verify that a pick was not edited after the fact.
Stack and operations
Modelling and simulation in Python (NumPy, PyTorch for the ensemble weighting); data pipelines pulling fixtures, statistics and odds from six providers with re-computation on news events; PostgreSQL and Redis; a Laravel back end with a React front end; containerised deployment on AWS. Model calibration (Brier score, closing-line value) is monitored in production and a drift alert opens a retraining ticket.
Who is this approach for?
This approach is for any team whose decisions depend on “how sure are we?” as much as on the answer: demand forecasting in retail and logistics, dynamic pricing, credit and fraud scoring, capacity planning. Erudil is the kind of forecasting system we build for clients — a calibrated probability model that is honest about uncertainty, connected to live data, and shipped with monitoring rather than a slide deck. Deloitte’s technology and sports outlooks (2024) expect data and AI to keep reshaping how sports organisations and media price and present outcomes; the same pressure applies in every industry that sells against a moving market.
Frequently asked questions
More case studies
AI knowledge assistants for a 30 000-employee grocery chain
Three RAG assistants on one platform — for commercial staff, store directors (by voice, from the shop floor) and HR — answer questions from corporate regulations with a citation to the exact clause, or say honestly that they do not know — so staff stop phoning head office for routine questions.
- Retail
- Python
- LangChain
- PostgreSQL + pgvector
Document AI that reads 1 300 supplier invoices a day
Scans and photos of invoices, delivery notes and acts go through a multimodal model that extracts typed fields with a confidence score per field, reconciles them with the supplier and contract master data, and posts to the ERP. Only low-confidence documents reach a human — roughly one in nine.
- Retail · Finance
- Python
- PyTorch
- Multimodal LLM
Catalogue AI: classifying new SKUs and cleaning 182 000 product cards
Two models on the product catalogue of a grocery chain: one suggests the classification code and category for every new item with top-3 probabilities, the other finds duplicate product cards semantically. Category managers confirm with one click instead of searching the classifier by hand; every confirmation feeds back into training.
- Retail · Master data
- Python
- scikit-learn
- Sentence Transformers